

You can find everything you need to know about Google Analytics on the Internet.
There are so many guides for setting up, tracking, and running Google Analytics for your website, at any experience level, for any type of site. If that’s what you’re looking for, you’ll have no problems finding it.
One thing we’ve noticed, though, is a lack of help when trying to analyze Analytics. Many blogs, and Google Help itself, will only tell you how to mechanically navigate it, but skip how to interpret and use the data it uncovers.
Without analysis, though, data’s virtually useless. Actually, literally useless. What good is knowing where your users are coming from, if you don’t dive into the why, the how, and the what-now of it?
By asking the right questions of your data, you can diagnose problems, find new avenues, nurture your market, and refine your strategy.
We’ve picked what we think are the most important metrics to look at for your own site, and what questions to ask in order to get more out of what you’ve already got (and then some).
Acquisition Overview
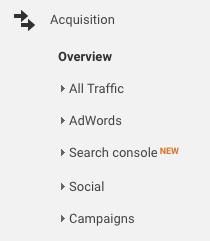
Acquisition reports are all about the where, as in where are these people coming from?
Analytics separates your incoming traffic into four groups:
Direct
These are the folks that typed or copy & pasted your URL directly into their address bar.
Social
These folks clicked through a link on Facebook, Twitter, LinkedIn, Instagram, etc. that took them to your site.
Organic Search
These visitors clicked your link after making a search query on an online search engine, like Google, Yahoo, DuckDuckGo, Bing, or others.
Referral
Referral traffic comes from other third party sites that have featured a link to your site.

Okay, so you have numbers. Start by ask yourself the following questions:
Where are people finding my web address?
Did anything I do – print ads, Twitter push, Facebook Live – affect these numbers?
Does the time I spend on different marketing strategies mirror my incoming traffic?
I’ve spent a sizable chunk of hours writing guest blog posts in the last few months – but I’m seeing very little traffic come through these guest posts. Is my time and effort worth it? Why or why not?
What are the bright spots, and why are they working?
We’re seeing a lot of direct traffic. Where are people finding our URL? Why are they visiting our site in particular? How can I reach this audience again?
How am I doing with organic search?
Search Engine Optimization (SEO) is a huge, complex, unclear system of strategies that have never really been confirmed to work. But everybody needs to familiarize themselves with it, at least a little, in order to drive in the most traffic. What am I doing to encourage organic search? Is it working?
Where would my audience – ideally – be coming from?
All sources of traffic are important, at least with some semblance of balance. But then again, would your audience be more likely to come from one source over another?
If you have a huge chunk of traffic coming from one channel, compare their behaviour to what other visitors check out.
Now what?
Interestingly enough, diving into the where are they coming from reveals a lot about who they are. And knowing (your audience) is half the battle!
Monitor how you’re spending your time and marketing dollars in comparison to your results. While I wouldn’t necessarily recommend a rigid dollar-for-dollar approach, use this info to allocate your resources more effectively.
Do paid advertising on your highest performing channel, but use highly-specific targeting features to narrow down who sees it to just your ideal consumer. Can you reach them? How do you capture a larger ideal audience?
Invest in your traffic. Whether it’s devoting more time and dollars to curating your Twitter feed, or buying more paid search advertising, or even hiring an SEO expert – treat traffic as a resource, and try to nurture it
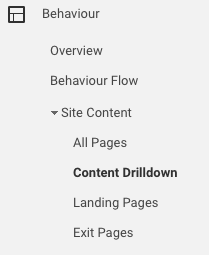
Behaviour → Overview

Behaviour reports look at what people are doing on your site, for how long, and then what makes them leave (almost).
Bounce rate
The percentage of people who leave your site after only visiting one page
An example: A visitor clicks a link to read your blog post “Mole People: Are They Really Like Us?”, but then exits that page without visiting any other pages on your site.
The bounce rate, if this was the only site visitor you had that month, would be 100%.
Exit rate
The percentage of people who leave a page, but it is not the first or only page they’ve visited on your site this session.
An example: A visitor types your URL into their address bar. They read a few of your blog posts, including Mole People. They exit your site after reading the blog post, “An Apology From The Editor”.
The exit rate for Apology would be 100% if this was your only site visitor this money.
Mole People’s exit and bounce rate would remain the same.
Entrances
The percentage of people who enter your site through this page (as a “landing page”). A landing page is not the same as a home page.
You should also look at number of pageviews, its relative percentage of traffic, and the average time spent on each page. Actually, just look at the full behaviour report for each page of your site, please?
Ask yourself the following questions:
Does this page suck?
This is most likely evidenced by your bounce rate. Are people leaving through a particular page?
Why are they leaving? Check for broken links, buggy loading, and other technical issues as well as content-related ones (more below).
Is this page doing what it’s supposed to do?
Are people completing online check-outs, or reading your long-form content, or signing up for your newsletter?
Is a high bounce rate for this page actually okay? For example, a “How-To” blog post may have a high bounce rate because your audience found the information they needed.
Find those bright spots
What’s working? Why is it working?
How can I use this to increase traffic to under-performing pages?
Now what?
Once you’ve found where people are leaving from, you can figure out why. Is it a functional issue, or a content-related one?
Review how long your audience is sticking around for. Don’t worry – it’s totally normal for visit times to seem obscenely short. Think of it this way: how long would you look at an individual billboard for? The point is, try not to “maximize all page views” or “lower your bounce rate”. Instead, try to uncover what your audience is finding valuable on your site. Then make more of it.
Finally, adjust your site to drive traffic to where you want it to go. If you’re seeing a bunch of exits at checkout, maybe make your payment process smoother and shorter. If visitors aren’t viewing more than one blog post, add more places for them to discover your content on each page. It can be simple as hyperlinking to your own content.
Behaviour → Site Content → Content Drilldown
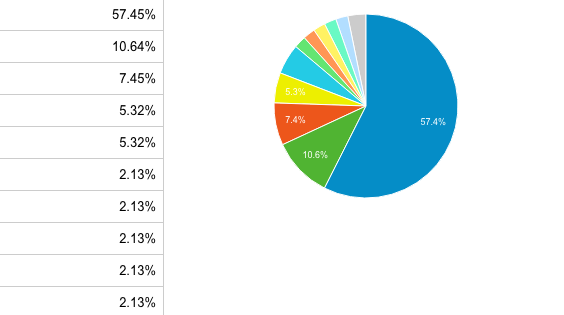
our blog pageviews
Your Content Drilldown report dives into the performance of your non-purchase pages.
For us, our most popular content page is our “Blog” page – the one that hosts all of our other blog posts. This makes sense, not only because it’s a landing page, but because a lot of our traffic is coming Directly. And people are clicking from our Home page to our Blog page. That’s a bright spot! From there, content views drops dramatically.
We can ask ourselves the following:
How are our headlines impacting what people choose to read (or not read)?
Are people finding our content topics relevant to their needs?
Why is one blog more popular than another?
Why are some older posts performing better than newer ones?
What is generating the most traffic from social?
And how is our social strategy affecting our viewership?
Now what?
Content bright spots can give you great insight to what your audience likes or doesn’t like. Are your long-form posts doing better than others? Does your audience prefer more images?
Dive into what your audience is finding useful, and then repeat it. Re-blog it, re-share it on social, repurpose it into new content, and explore how to make it even more effective.
Think about your headlines. Are they attention-grabbing, problem-solving, and clickable? Contently has a great headline analyzer that can help you determine if your headlines are emotional enough.
Are you hitting readability standards? Short paragraphs, interesting graphics or images, bolded phrases and keywords can all help keep visitors reading your content. Check out your content’s reading level – is it appropriate for your audience?
Audience analysis

None of your marketing efforts can be effective without a thorough understanding of your audience.
But your ideal – or perceived audience – may be entirely different from who is actually using your site. My favourite example?

Bronies.
If you didn’t know, My Little Pony: Friendship is Magic is a children’s television show that inexplicably (but not really) has a large Millennial male following.
While this is a little extreme deviation, many brands find other off-audience results.
Pepsi markets its Gatorade line primarily to young, male athletes, but found an accidental niche in high school vending machines. While this might sound like it’s the same market – young, male athletes are often in high school, aren’t they? – a deep drilldown found that the high school lunch crowd is drinking sports drinks without sportsing, because it makes them feel like they’re actual athletes.
The Audience section of Analytics is easily my favourite, and ideally you should be spending a lot of your time here. It helps you understand the who of who is visiting your site.
These are the people who are visiting our site. Now, we’re a full-service marketing firm, but we’re finding a lot of our visitors aren’t actually business professionals, organizational CEOs, or market analysts.
What we’re finding is that they’re cultural capital enthusiasts.
Weird, right? We can ask ourselves these questions:
Why are specific niches coming to us – and how are they evening finding us?
Why would “Travel Buffs” be interested in our site? How did they come across it? Are they buying our product?
How are we portraying ourselves online, on our site, through our content, and on social?
Why does our brand identity appeal to these unique audiences?
Is it the reading level, length, or density of our content that’s attracting “Political News Junkies”? Are “Shutterbugs” coming from Google Images?
How can we appeal more to our ideal audience?
And can we convert these niche audiences into paying customers, subscribers, or brand advocates?
Now what?
We’ve noticed a large artistic following for our brand, despite being a corporate-ish marketing firm. We feel (hope?) that it’s partially because our employees are active social media users and habitual retweeters. Internal referral traffic has become an important part of our audience – and we nurture it by encouraging social media use, trying out new platforms, and engaging with our visitors.
For you, asking yourself the important questions is the best place to start diving into your Analytics. Review how your site is working, find who your audience is, uncover what they love, and make more of it.
Have any questions? We’d love to chat. Feel free to contact us anytime, anywhere!